VECTOR MAP
Studying the tree density in Utrecht, I used a
vector map to produce a breakdown per neighborhood.
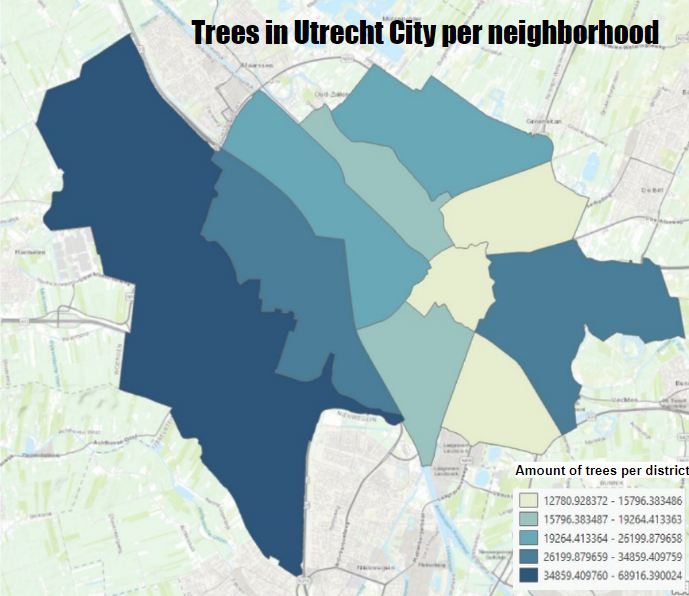
The vector map of Utrecht's tree distribution vividly illustrates the spatial variation of arboreal density across its neighborhoods, with Vleuten - De Meern emerging as the area boasting the highest concentration of trees. This comprehensive visual representation utilizes precise geographic data to highlight the density and distribution patterns, allowing for an in-depth analysis of urban forestry. Vleuten's prominence in tree density suggests a strong emphasis on green spaces and environmental sustainability within this neighborhood. The higher tree density can enhance air quality, provide cooler microclimates, and improve the overall quality of life for residents. Conversely, neighborhoods with lower tree densities might experience less of these benefits, indicating potential areas for urban greening initiatives. By juxtaposing Vleuten with other parts of Utrecht, the map underscores the importance of equitable distribution of green spaces in urban planning and the positive impacts of urban forestry on community well-being.